
The current ICC men's team rankings in Tests, ODIs and T20Is, with the top ten in each format, where Pakistan stand and how the rating is worked out.
Tables last checked against the official ICC website on 19 November 2026.
The ICC cricket rankings are the official tables that compare international teams. This page covers the ICC cricket rankings for men’s teams in all three formats.
The ICC men’s team rankings show how international sides compare in each of cricket’s three formats: Tests, One Day Internationals (ODIs) and T20 Internationals (T20Is). Each format has its own table, so a team can be near the top in one and mid-table in another. This guide gives the current top ten in all three and explains how the numbers work.
The picture right now
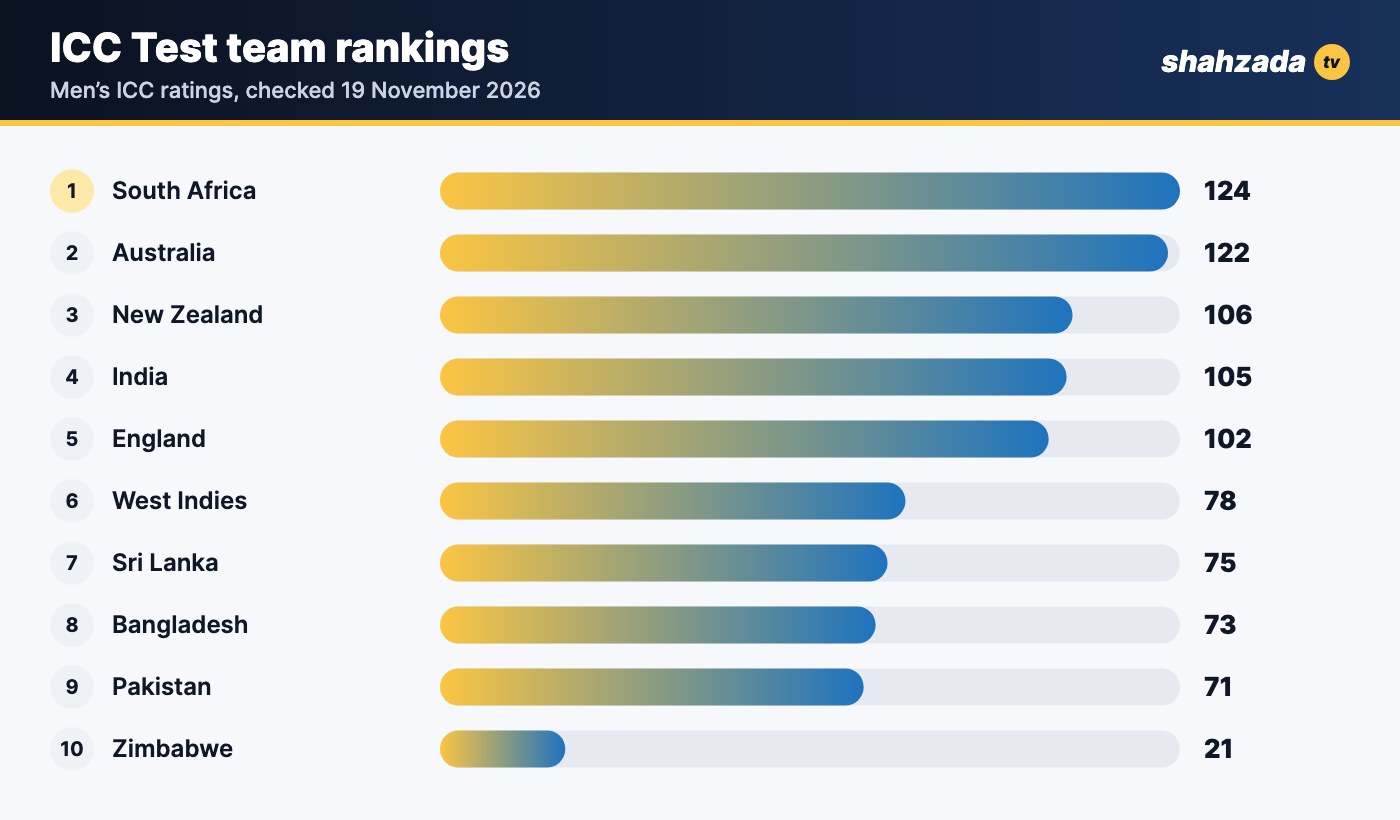
- Tests: South Africa lead on 124, two rating points ahead of Australia.
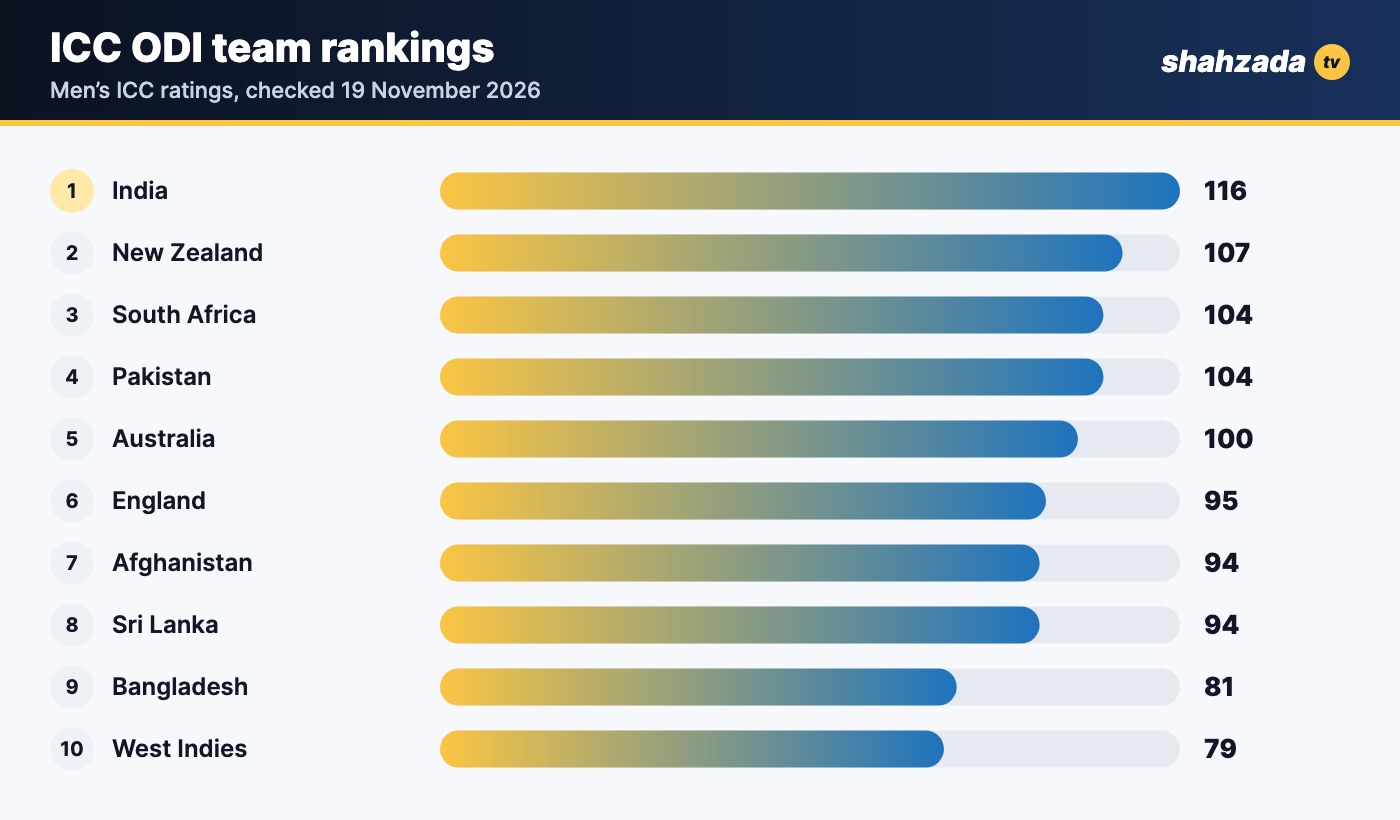
- ODIs: India are first on 116, nine clear of New Zealand.
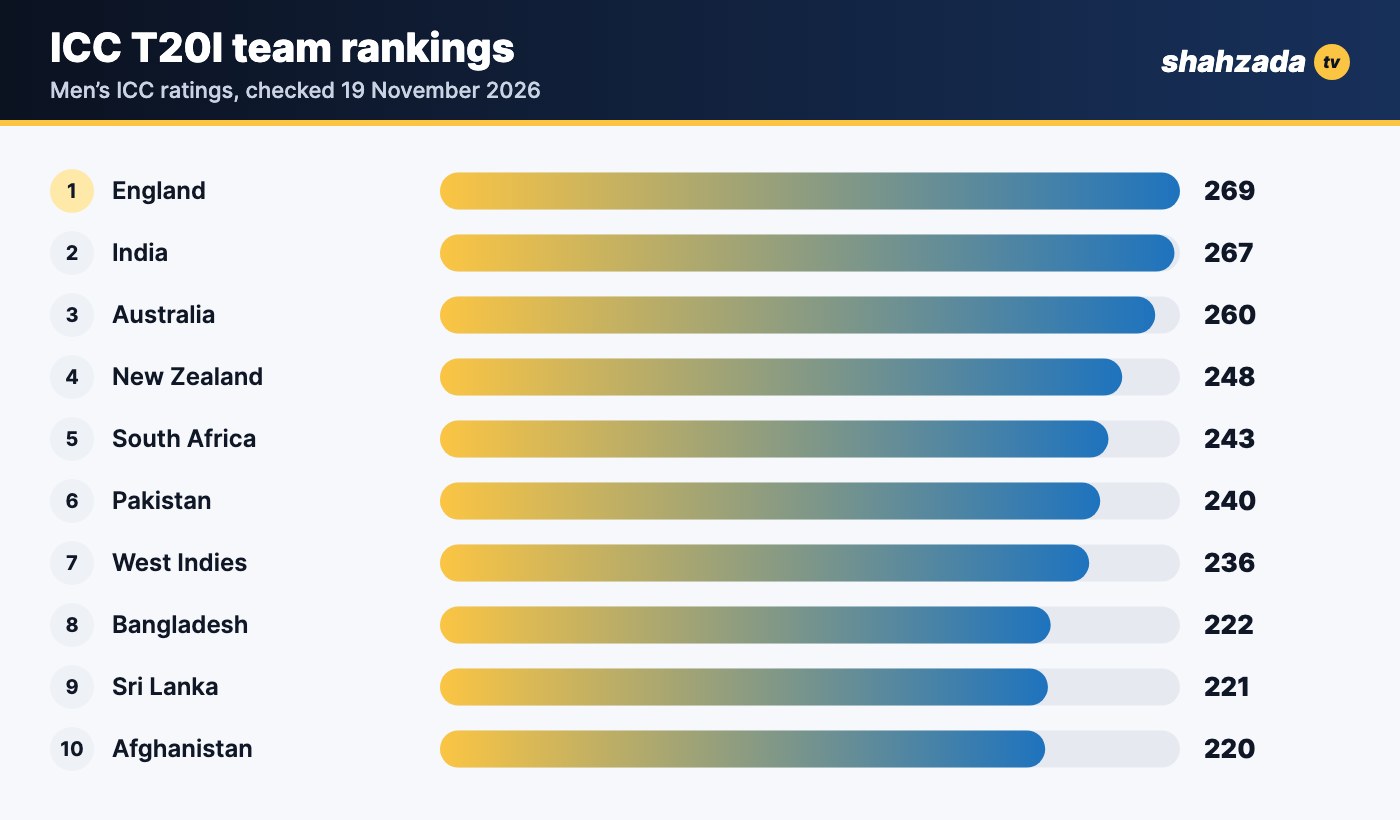
- T20Is: England are top on 269, with India two points behind on 267.
- Pakistan are ninth in Tests, fourth in ODIs and sixth in T20Is.
- India and New Zealand are the only teams inside the top four of all three tables.
ICC cricket rankings: men’s Test teams
South Africa and Australia are well clear of the field, with a 16-point gap between second and third. The ICC’s Test table currently lists ten teams.
| Pos | Team | Matches | Points | Rating |
|---|---|---|---|---|
| 1 | South Africa | 23 | 2,860 | 124 |
| 2 | Australia | 31 | 3,787 | 122 |
| 3 | New Zealand | 22 | 2,336 | 106 |
| 4 | India | 29 | 3,042 | 105 |
| 5 | England | 36 | 3,658 | 102 |
| 6 | West Indies | 30 | 2,339 | 78 |
| 7 | Sri Lanka | 19 | 1,434 | 75 |
| 8 | Bangladesh | 28 | 2,038 | 73 |
| 9 | Pakistan | 23 | 1,623 | 71 |
| 10 | Zimbabwe | 16 | 338 | 21 |
ICC cricket rankings: men’s ODI teams
India hold a comfortable lead. Behind them the table is tight: South Africa and Pakistan share a rating of 104, with South Africa placed third because their rating is fractionally higher before rounding. Afghanistan and Sri Lanka are also level on 94.
| Pos | Team | Matches | Points | Rating |
|---|---|---|---|---|
| 1 | India | 40 | 4,653 | 116 |
| 2 | New Zealand | 39 | 4,172 | 107 |
| 3 | South Africa | 34 | 3,547 | 104 |
| 4 | Pakistan | 37 | 3,838 | 104 |
| 5 | Australia | 38 | 3,796 | 100 |
| 6 | England | 41 | 3,886 | 95 |
| 7 | Afghanistan | 31 | 2,926 | 94 |
| 8 | Sri Lanka | 44 | 4,144 | 94 |
| 9 | Bangladesh | 41 | 3,304 | 81 |
| 10 | West Indies | 37 | 2,924 | 79 |
The full ODI table on the ICC site runs to 20 teams, including Zimbabwe, Scotland, Ireland, the Netherlands, the USA, Namibia, Nepal, the UAE, Oman and Canada.
ICC cricket rankings: men’s T20I teams
This is the closest race of the three. Only two rating points separate England and India at the top, and the first seven teams are all above 235. T20I ratings sit on a much higher scale than Test and ODI ratings, so the numbers should not be compared across formats.
| Pos | Team | Matches | Points | Rating |
|---|---|---|---|---|
| 1 | England | 41 | 11,021 | 269 |
| 2 | India | 76 | 20,268 | 267 |
| 3 | Australia | 38 | 9,868 | 260 |
| 4 | New Zealand | 55 | 13,638 | 248 |
| 5 | South Africa | 53 | 12,881 | 243 |
| 6 | Pakistan | 62 | 14,883 | 240 |
| 7 | West Indies | 60 | 14,155 | 236 |
| 8 | Bangladesh | 55 | 12,220 | 222 |
| 9 | Sri Lanka | 52 | 11,489 | 221 |
| 10 | Afghanistan | 44 | 9,679 | 220 |
The T20I table is by far the longest, with 100 teams ranked.
Where Pakistan stand
| Format | Position | Rating |
|---|---|---|
| Test | 9th | 71 |
| ODI | 4th | 104 |
| T20I | 6th | 240 |
Pakistan’s strongest format in the ICC men’s team rankings is the ODI, where they are level on rating with third-placed South Africa. In Tests they sit ninth of the ten listed teams, two points behind Bangladesh.
How the rating is worked out
Every table has the same three numbers next to each team:
- Matches: how many games count towards the team’s rating. Older results carry less weight than recent ones, so this is a weighted figure and not a simple count of games played.
- Points: the total a team has earned from those matches. A win earns more points when it comes against a higher-rated opponent.
- Rating: points divided by matches, rounded to a whole number. This is the figure that decides the order.
You can check it yourself. South Africa’s Test rating is 2,860 points from 23 matches, which is 124.3 and rounds to 124. India’s ODI rating is 4,653 from 40, which is 116.3 and rounds to 116.
Because the rating is an average, playing more matches does not move a team up by itself. India have 76 T20I matches in the table to England’s 41, yet England are ahead because their points per match are slightly higher.
Quick answers
Who is number one in Test cricket?
South Africa, with a rating of 124.
Who is number one in ODIs?
India, with a rating of 116.
Who is number one in T20Is?
England, with a rating of 269.
Why do two teams with the same rating have different positions?
The published rating is rounded. When two teams show the same number, the one with the higher figure before rounding is placed first.
Sources
All figures are from the International Cricket Council’s official tables: Test, ODI and T20I. Rankings change as matches are played, so check the ICC site for the very latest positions.
For individual players, see our guide to the ICC men’s all-rounder rankings.
We update this ICC cricket rankings page whenever the official tables change.